I am one of those people who needs to see the data or to perform the experiment myself to see if I agree with something. That sometimes gets me in trouble when I hesitate to go along with the crowd before having done my research. Sometimes, that research doesn’t agree with the official position. I made myself an expert on aquifers, especially those in Nebraska. This got me involved in water policy decisions. I have found that getting everyone on the same page as to what the facts are helps eliminate some of the disagreements.
A long time ago, I read a magazine article on how climate change was going to cause more 100 degree days in the middle of America. It showed a couple of maps with a large increase in the higher temperatures projected over the next several decades. So, I decided to go and look at the historical data and see for myself what the data showed.
I accessed the NOAA climate records for every station in the nation. I then converted some of that information to something that could be more easily analyzed. I did that for every station in Nebraska. I, then, did it for random stations around the nation, focusing on stations that had at least 60 years of data. There are not that many. Most station data is less than 50 years, and there are often large gaps where no data is present.
For the majority of the stations I analyzed, there are fewer hot days now than there used to be. At most stations, nights don’t get as cold as they used to. In other words, at most stations in the US, there is a moderation of temperatures. It is not as hot and not as cold as it used to be. The map I saw that predicted many more very hot days is a fabrication and not based on the historical trends:
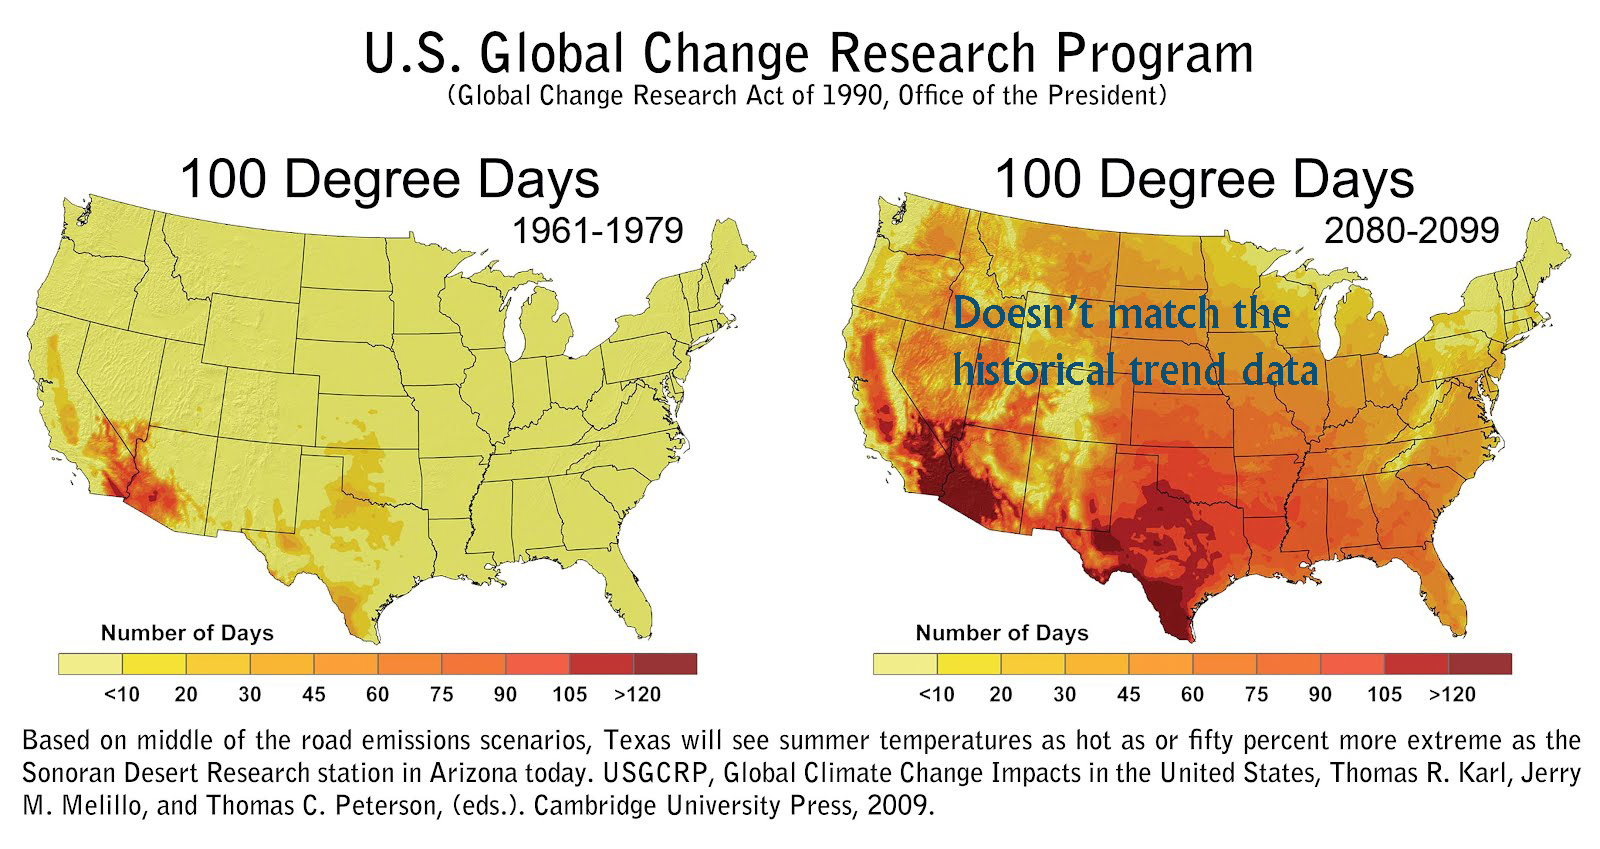
The map that inspired my research and discovery that almost none of the stations in the United States show the high temperatures as trending higher over their period of record. When the lows and highs are averaged together there is a slight warming trend because in most places in the nation there are not as many cold nights as there used to be which makes up for the fewer hot days most stations are seeing.
I have placed here, on this site, the climate information as derived from the station on Orcas Island and maintained by the Willis family for over a hundred years. While the data is not perfect, it is some of the most consistent and oldest continuous data in the nation.
In short, Orcas is not seeing much of a change in its high temperatures over the last 120 years. Take a look at the data and charts to see for yourself. Orcas, unlike much of the rest of the nation, is seeing more colder lows than it used to. Not much, but a bit of a cooling trend when looking at the low temperatures. There is less rain than there used to be. A hundred years ago, the average precipitation for the island was about 29.75 inches. It is now trending to about 27.5 inches.