Expected and historical occurrences —-
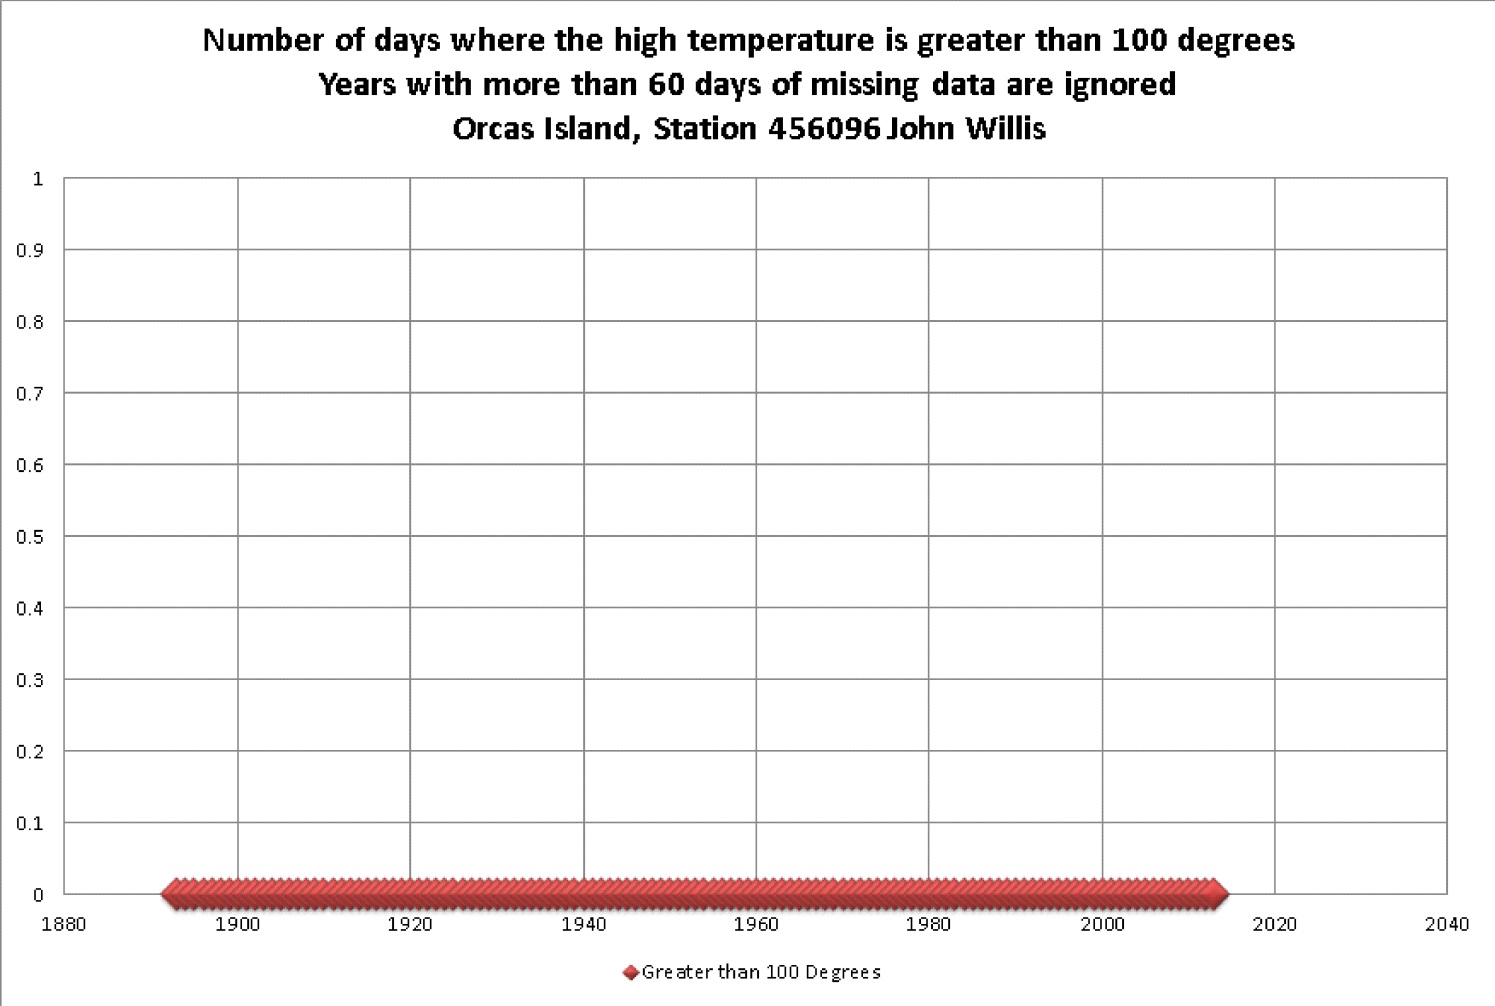
Typical days in year with temps over 100
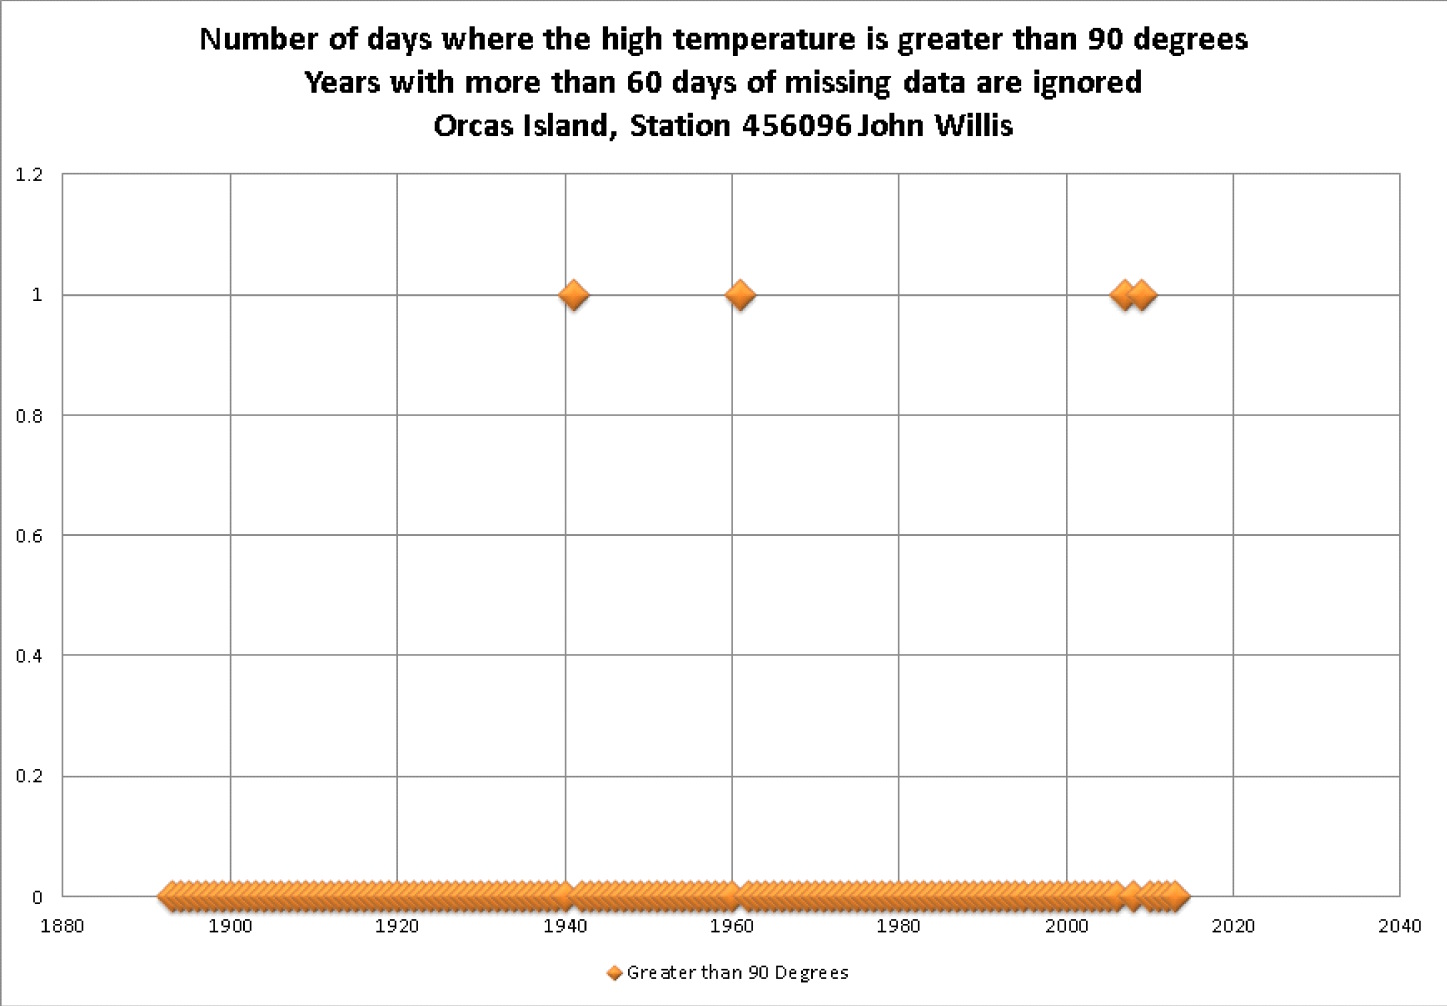
Typical days in year with temps over 90
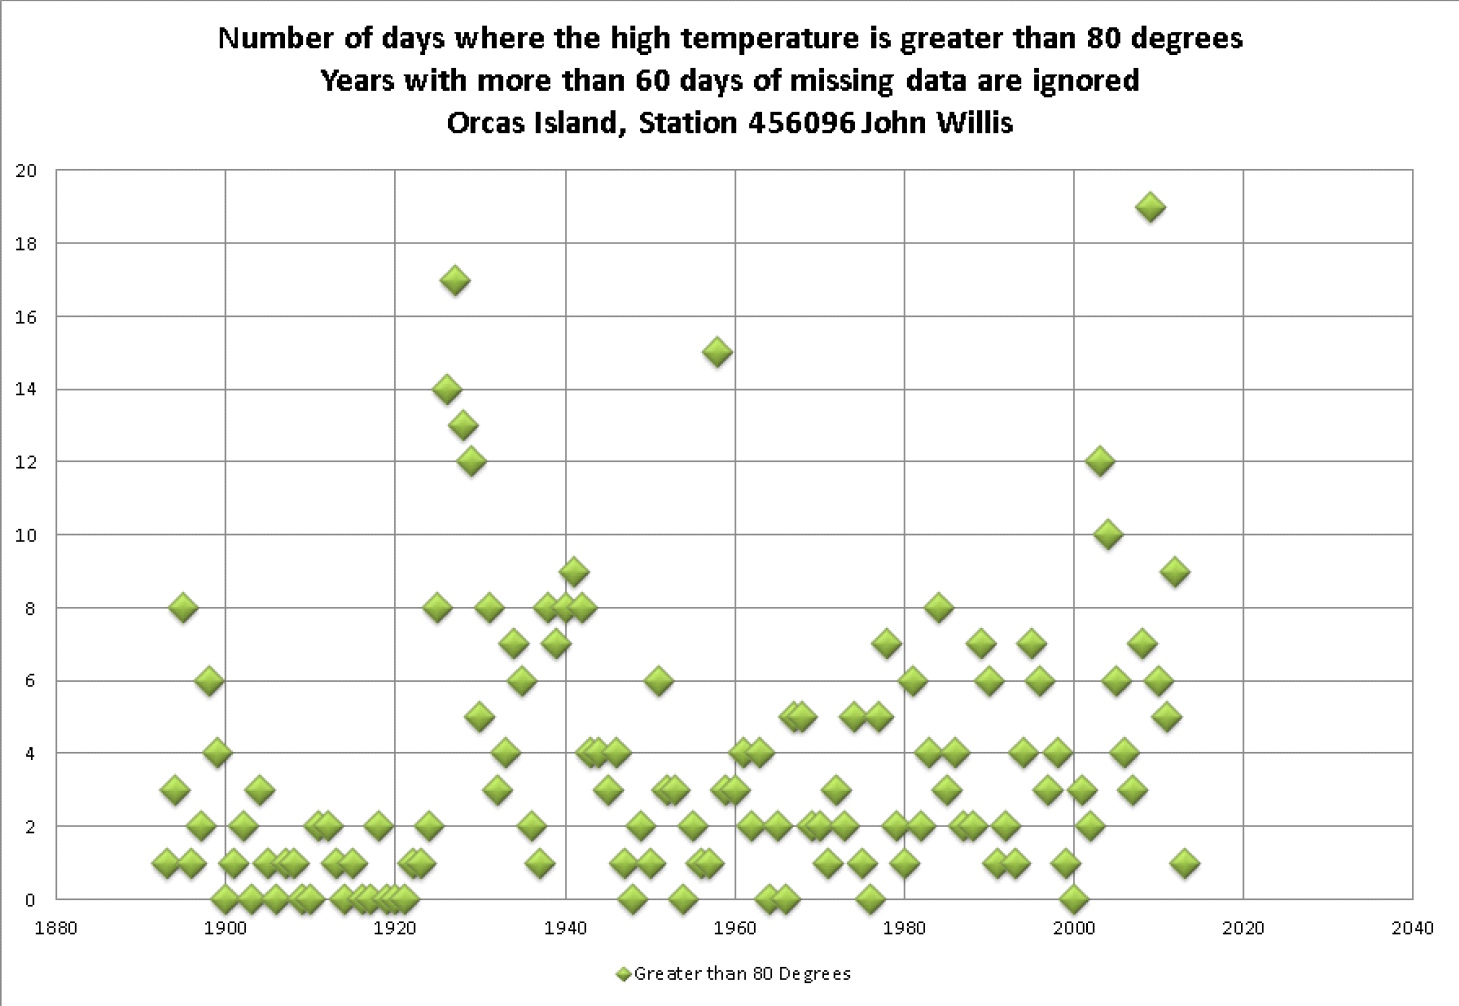
Typical days in year with temps over 80
Typical days in year with temps over 70
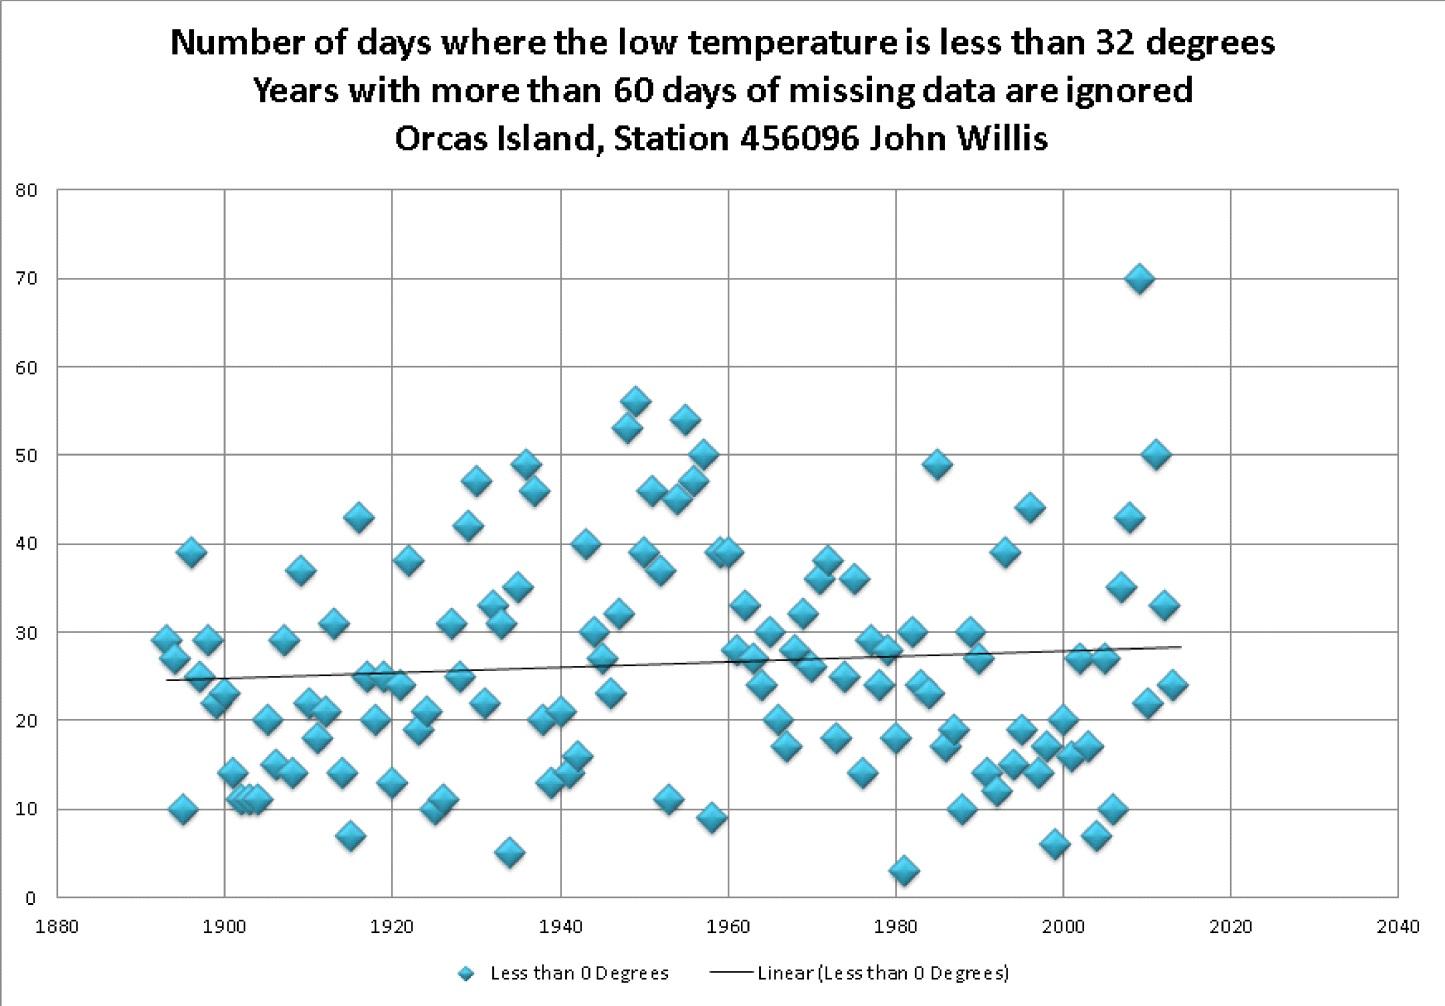
Typical days in year with temps below 32
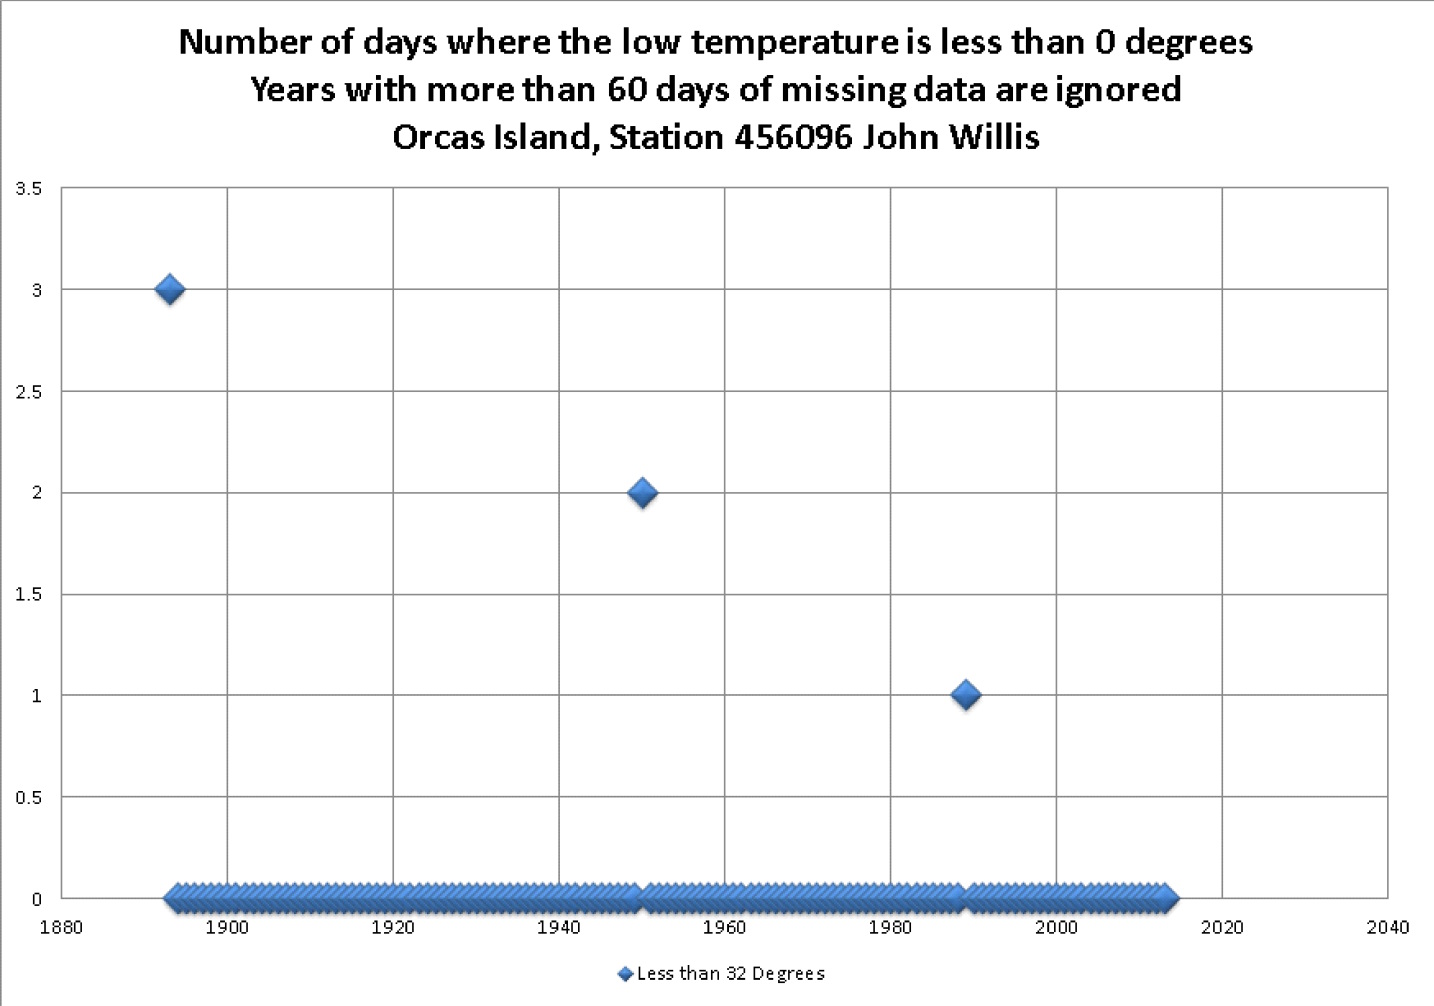
Typical days in year with temps below 0
Avg/Year
0
0
4
38
26
0
Occurrences
0
4
455
4,535
3,200
6
Daily High Temperatures 1893-2013
Temperature % of Days Historical
Range High Temp Occurrences
100+ 0% 0
90-99 0% 4
80-89 1% 451
70-79 9% 4,080
60-69 33% 14,637
50-59 31% 13,443
40-49 21% 9,220
30-39 4% 1,933
20-29 0% 212
Less than 20 0% 46
Daily Low Temperatures 1893-2013
Temperature % of Days Historical
Range Low Temp Occurrences
70+ 0% 3
60-69 0% 103
50-59 17% 7,764
40-49 45% 19,369
30-39 34% 14,846
20-29 4% 1,556
10-19 0% 354
0 – 9 0% 27
-10 to -1 0% 6
Below -11 0% 0
Precipitation data ————————————
Days per year with no precipitation ——————
Days with trace to 0.25″ precipitation —————-
Days per year with more than 0.25″ precipitation —-
Days per year with more than 1.00″ precipitation —-
Avg Days
232
108
25
0
—-
64%
30%
7%
0%
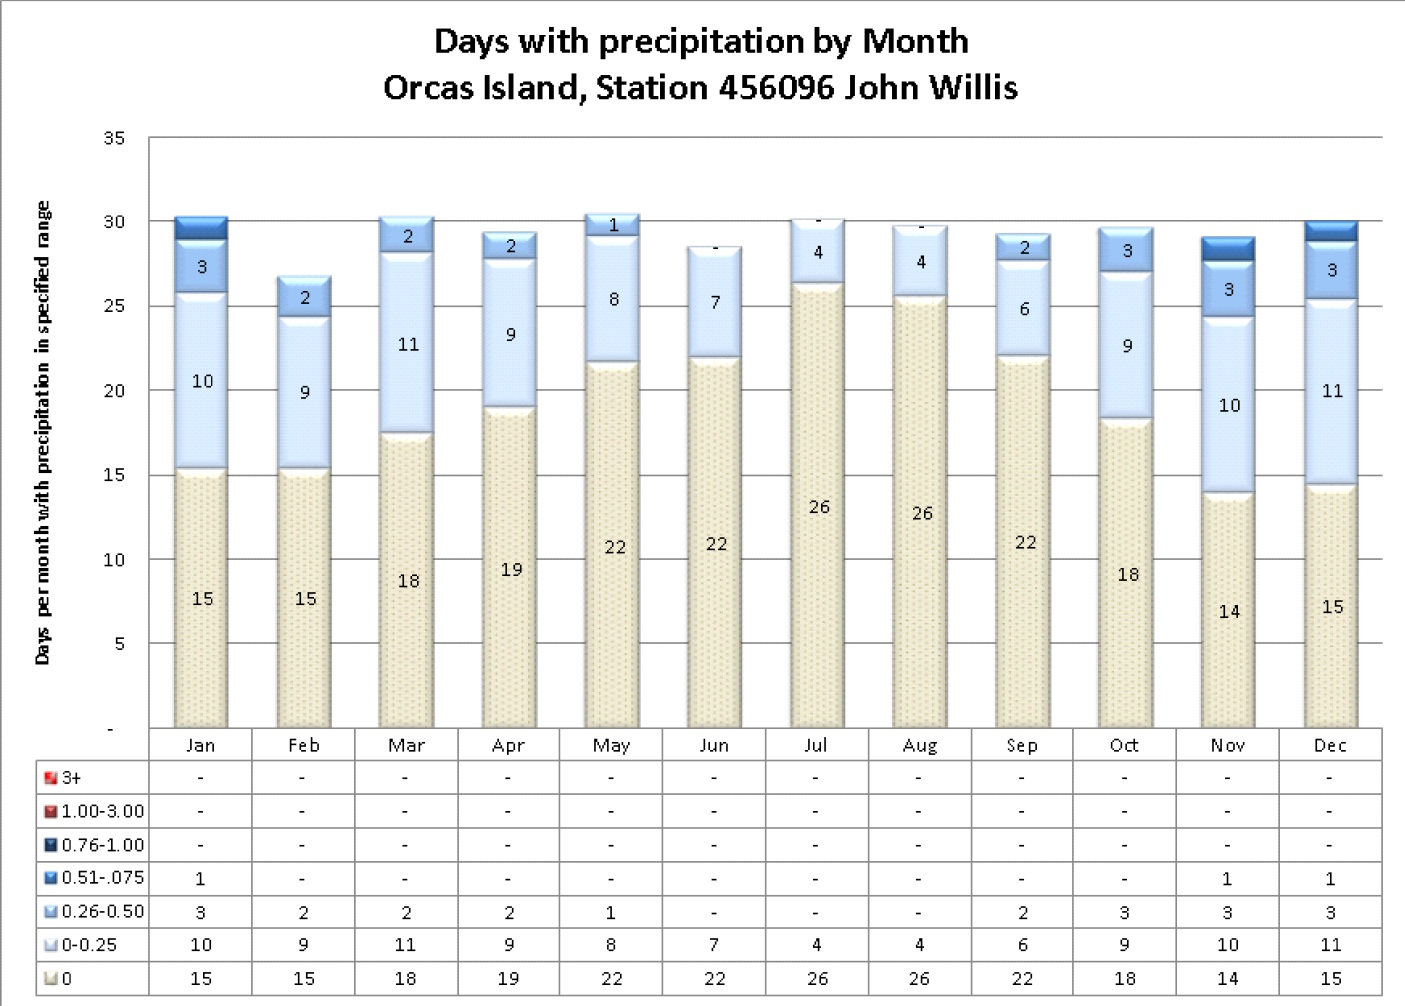
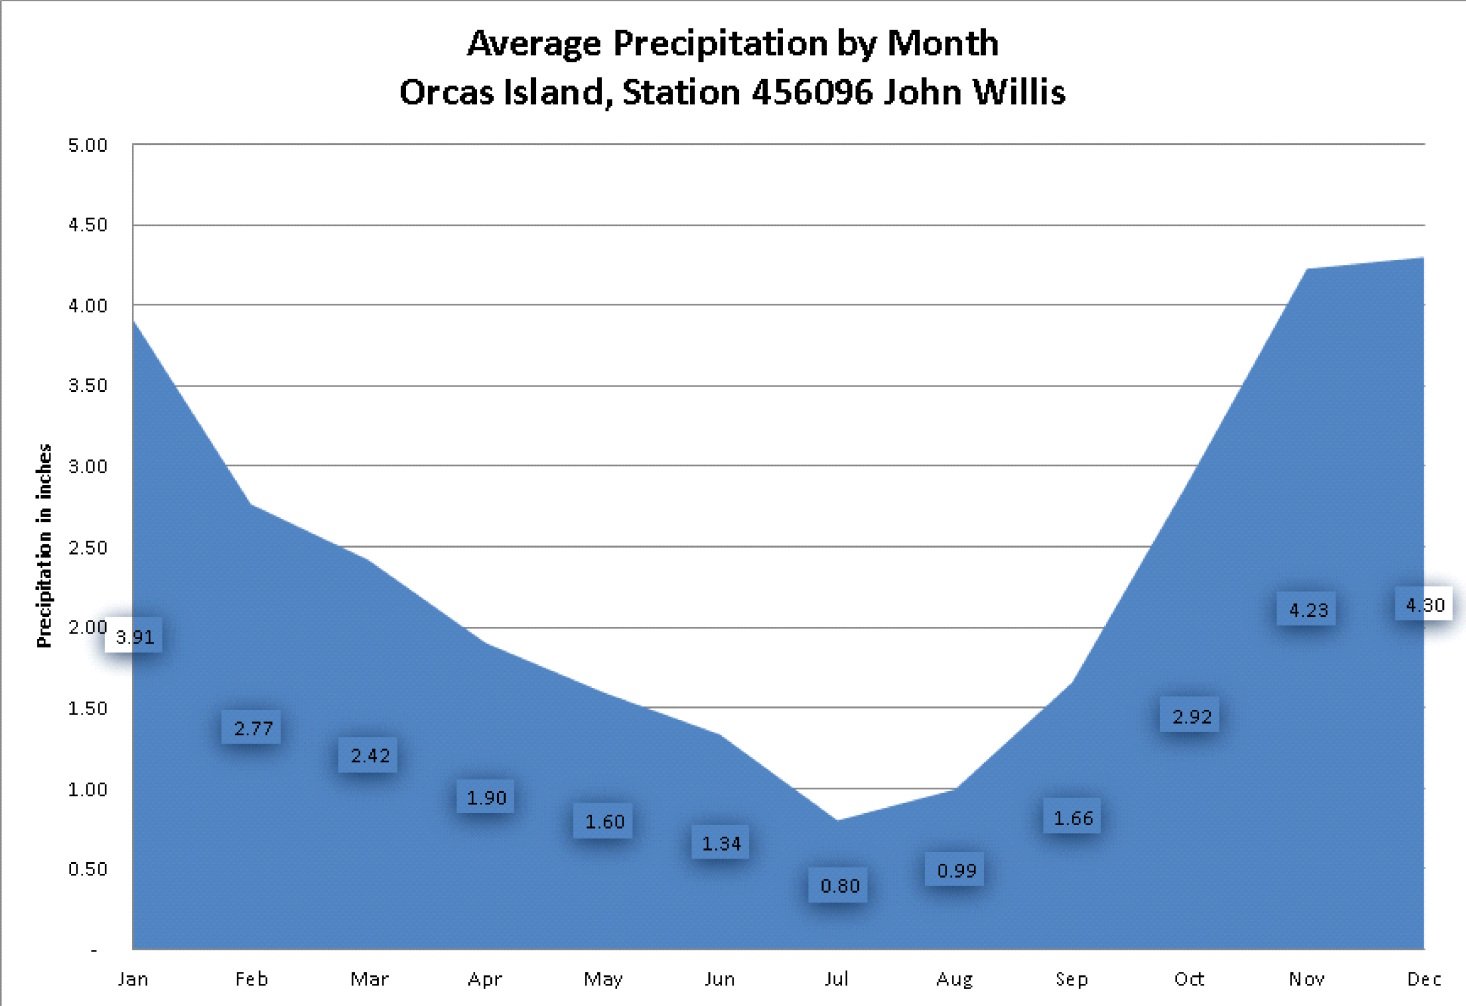
Month
Jan
Feb
Mar
Apr
May
Jun
Jul
Aug
Sep
Oct
Nov
Dec
Total
Inches
3.95
2.81
2.47
1.88
1.61
1.33
0.81
1.00
1.68
2.95
4.19
4.34
29.02

Year of first usable record
Years of data used in analysis
Years ignored since first year used
Percentage of years used since first year used
Percentage of years missing since first year used
Total days in the years that were used
Number of Days with missing temperature data
Percentage of days missing temp data
Number of days with missing precipitation data
Percentage of days missing precip data
1893
121
0
100%
0%
44,165
199
0.45%
1,047
2.37%
Period of analysis 1893 – 2013
Analysis of weather data for weather station 456096, which is located on John Willis’ property on the southwest side of Orcas Island. It has the distinction of being the longest continuous set of weather records maintained by a private family in the United States. For this reason, it is one of the more valuable sets of data in the nation.
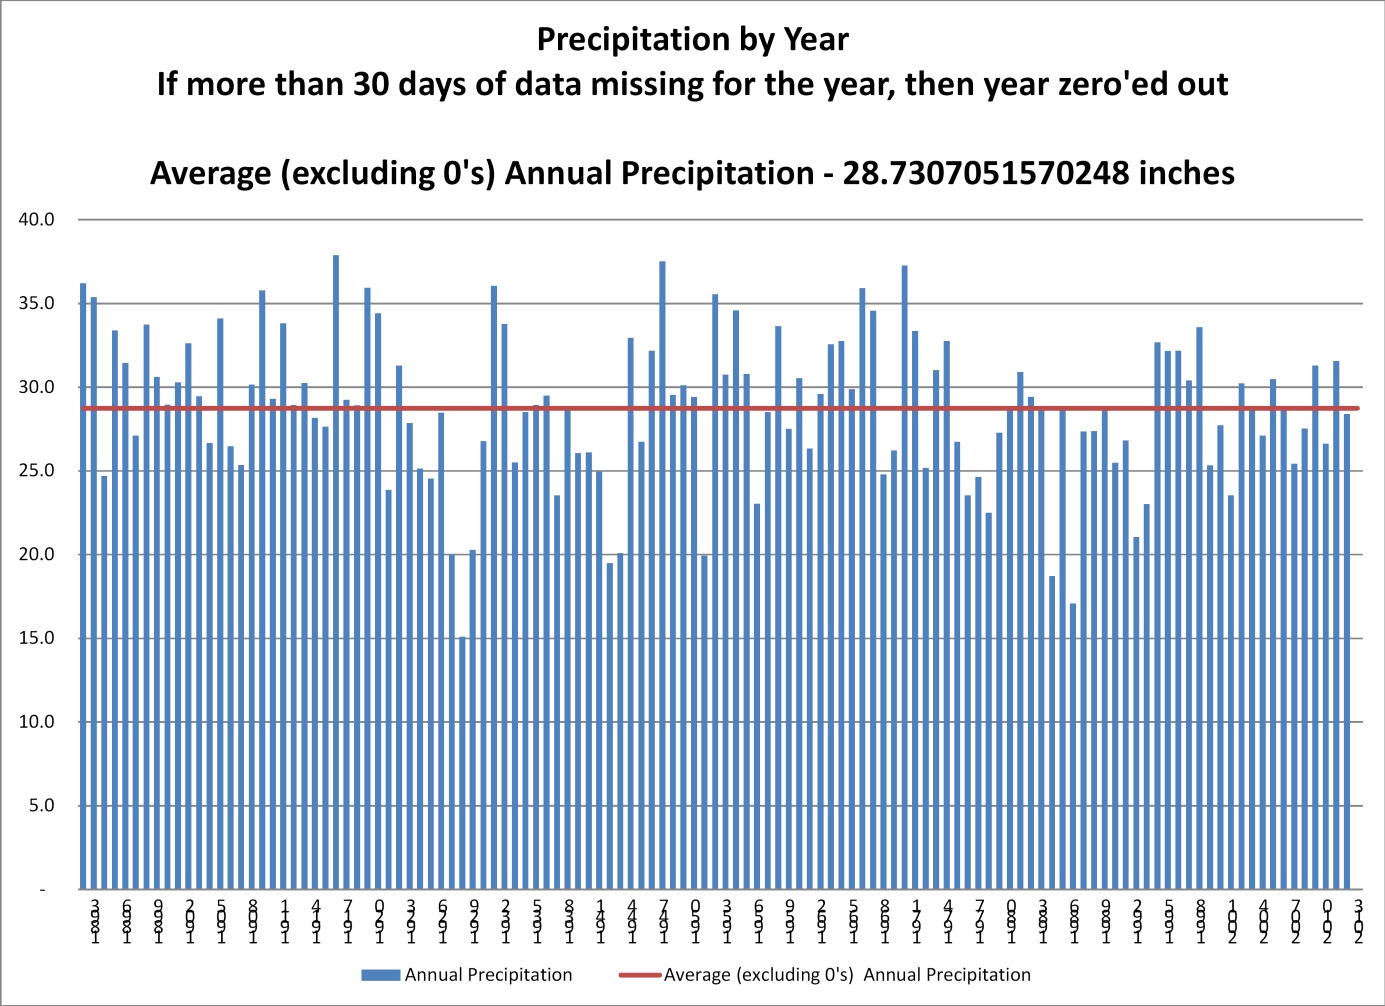
The weather records were pulled from http://www.ncdc.noaa.gov/ which maintains a continuous set of error-corrected data for many of the stations in the nation. The data was converted from Celsius to Fahrenheit. Days without temperature records were either ignored or set as the average between the two most recent records to allow for nonparametric trend analysis. Days without precipitation data were ignored. So, if it precipitated on a day without a record, then the total precipitation for that year would be under-reported. Out of the nearly 45,000 days in the period of record, there are only 199 days without temperature records. There are 1,047 without precipitation data.
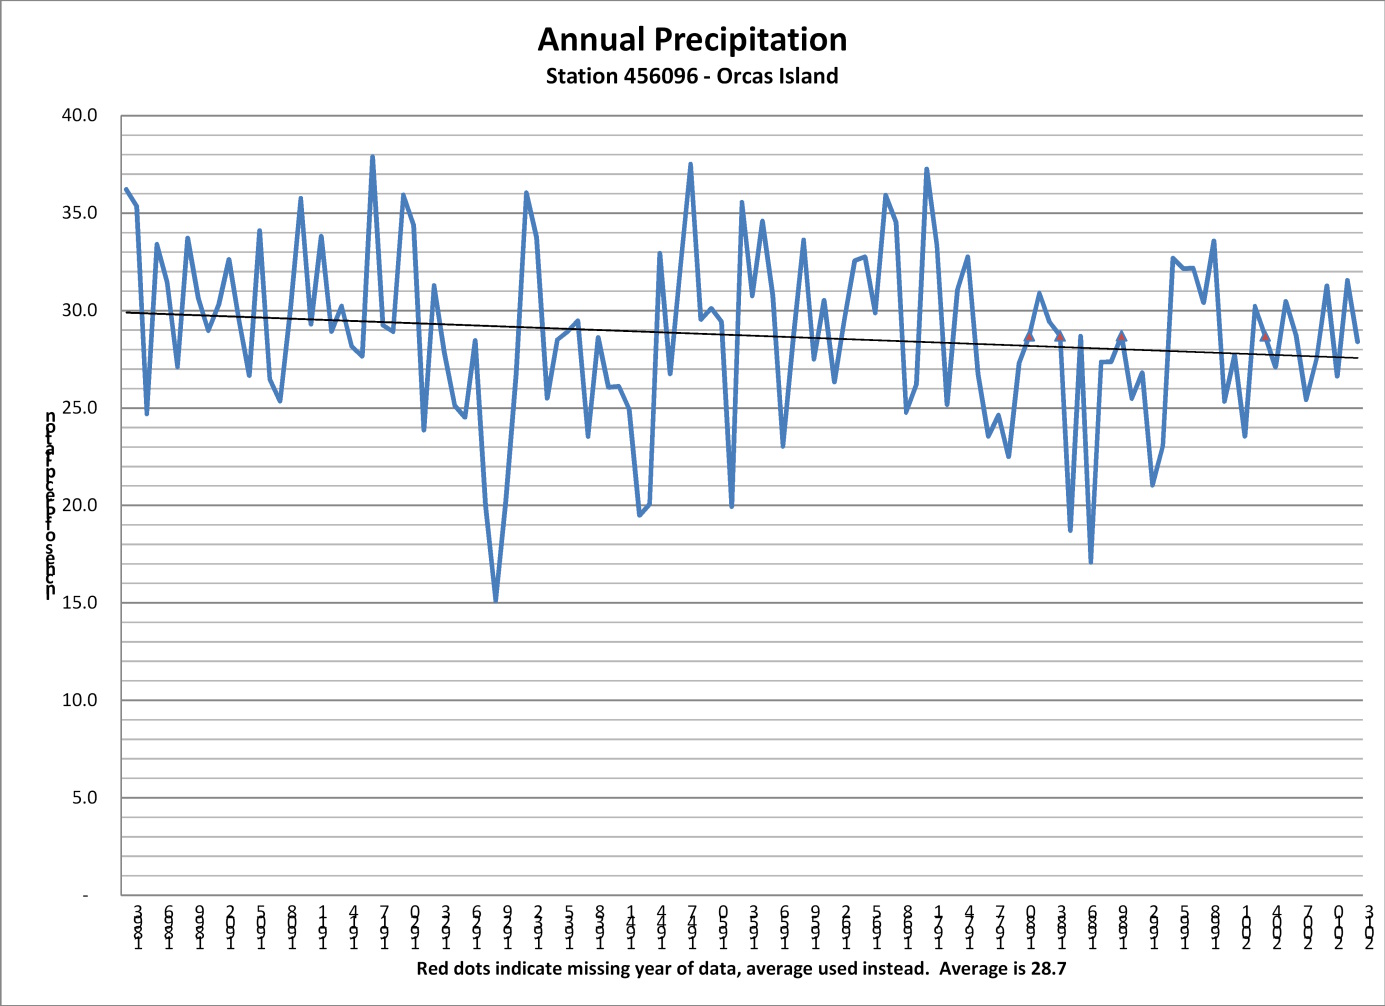
The most notable point of interest is the significant jump in the high temperatures beginning in 1925. Beginning in 1925, all subsequent high temperatures are about two degrees higher on average than all average temperatures prior to that date. It is my opinion that something happened to the high temperature gauge between 1924 and 1925. Any trend analysis needs to take into consideration this unexplained leap in temperatures.
In most other locations that have been analyzed across the nation, the trend is for the high temperatures to be trending lower and for the low temperatures to be trending higher. Note that this is significantly different than what is reported by the press. In other words, in most locations, the reality is that there is a moderation of temperatures — with highs not being quite as high as they used to be and for lows to be a bit warmer than they used to be.
On Orcas, things are a bit different than the other stations that have been studied. On Orcas, there are more days with colder low temperatures, meaning that the lows are trending colder. Regarding the high temperatures, the trend depends on where you start the trend line. If you go from 1893 to 2013, then the trend is significantly warmer for the highs. But, this is due to the jump in 1925. If you trend from 1925 to 2013, then the trend is cooler.
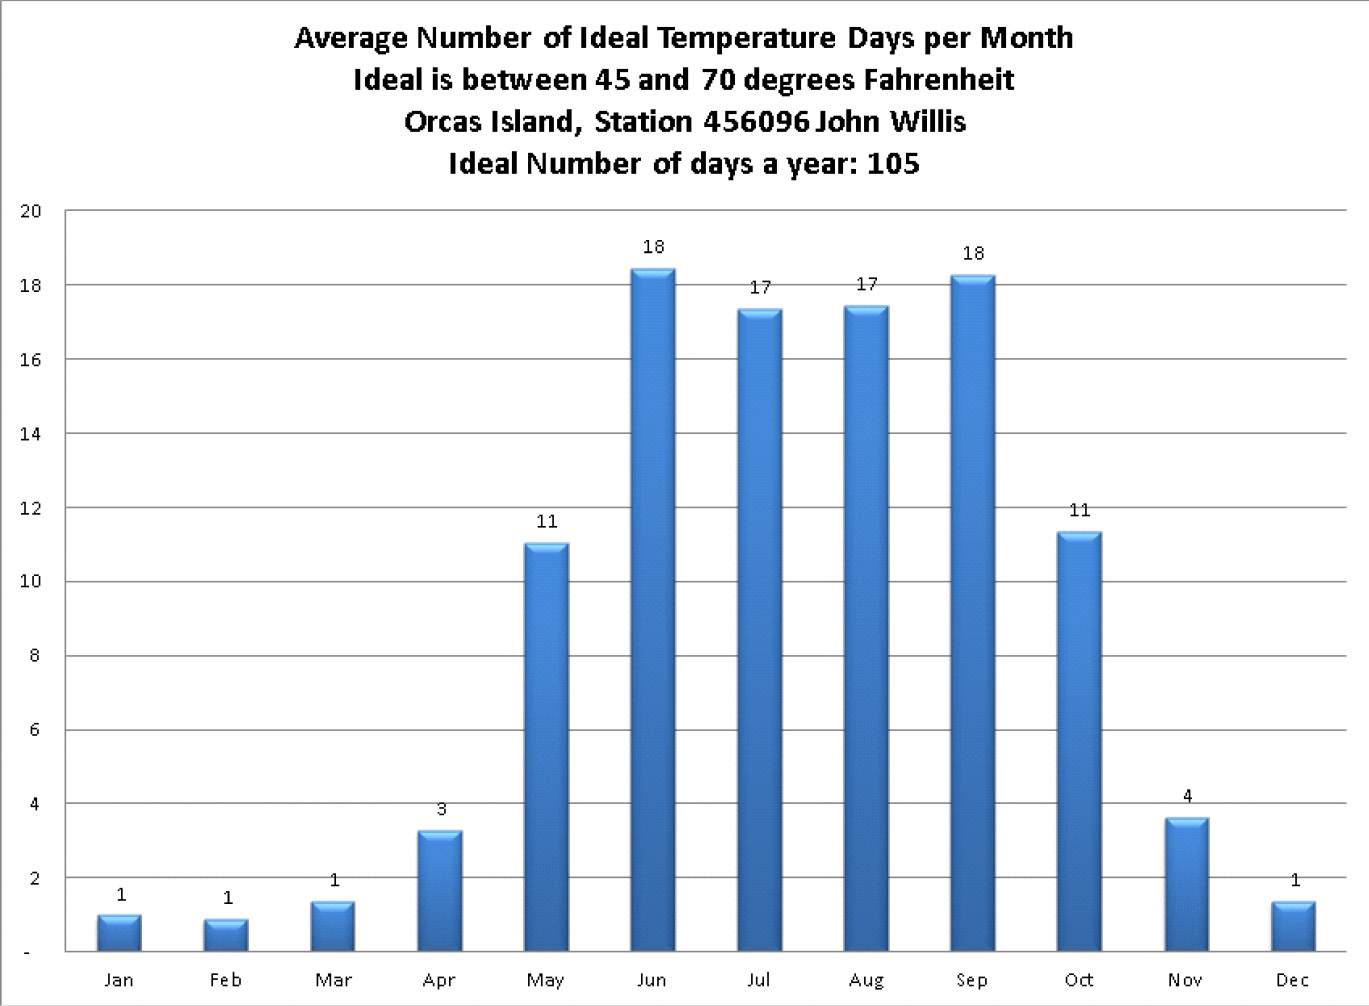
If you consider temperatures between 45 and 75 to be an ideal range for a day, then Orcas Island is one of the most ideal in the nation. Approximately, 25% of the days in the year see some precipitation but the vast majority of that is measured between a trace and a quarter of an inch. On average, only three days a year show more than a half inch of precipitation.
Data compiled by Steve Smith. You are welcome to a copy of the analysis worksheet or the summary information. Just ask. Orcas.Art@gmail.com
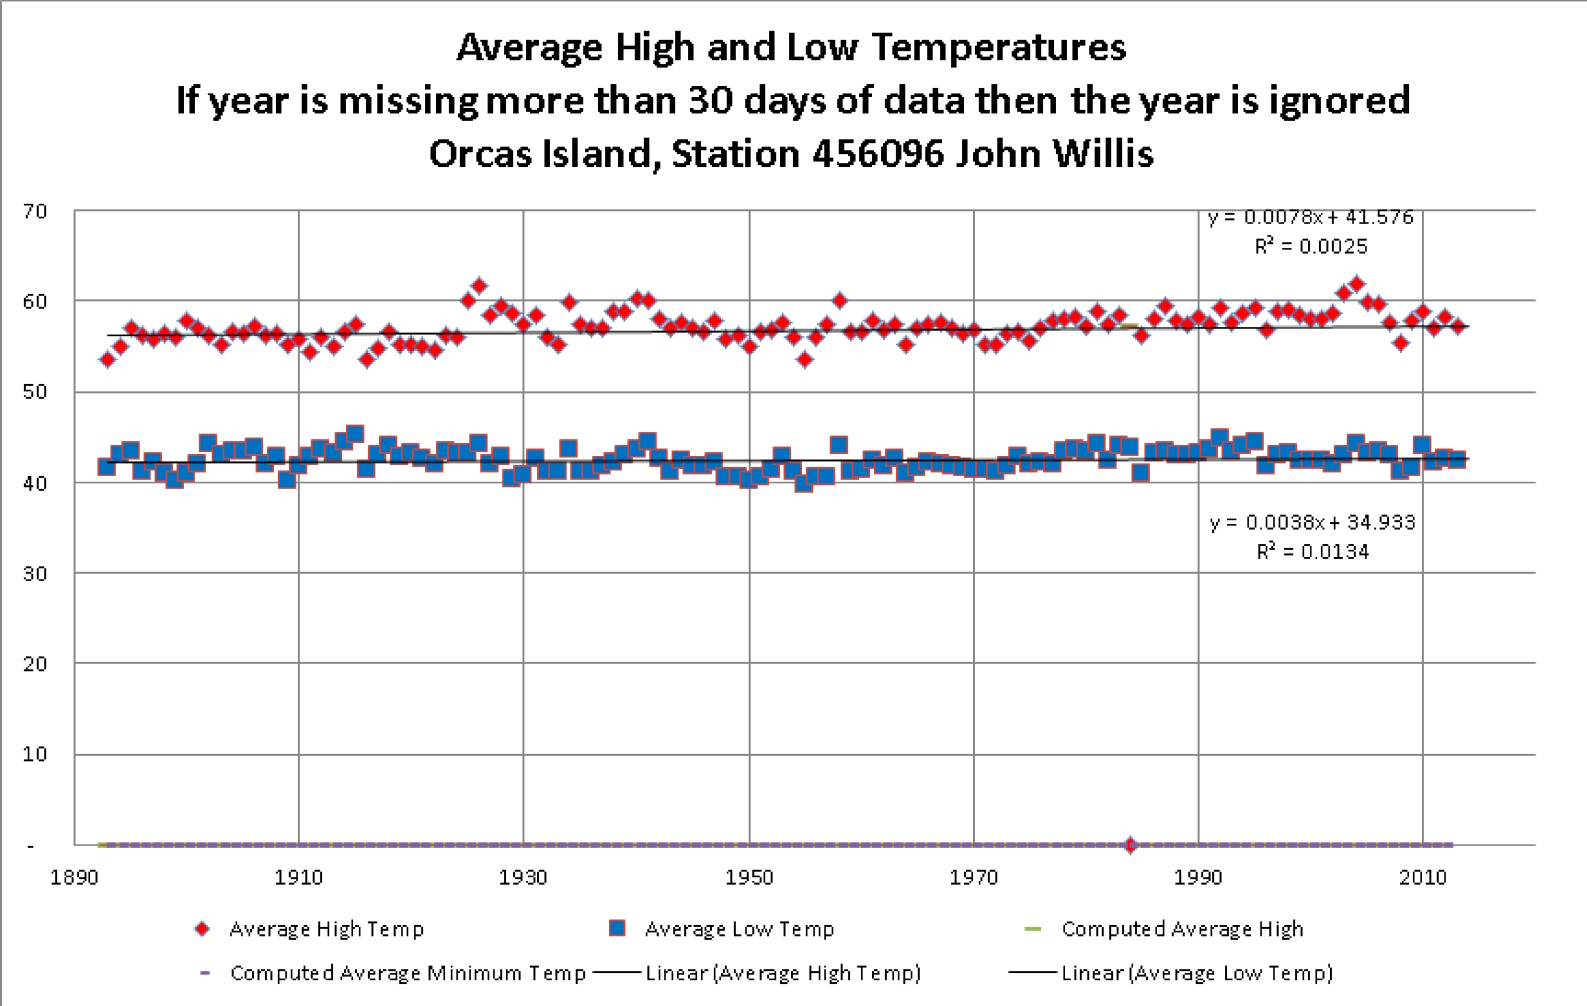
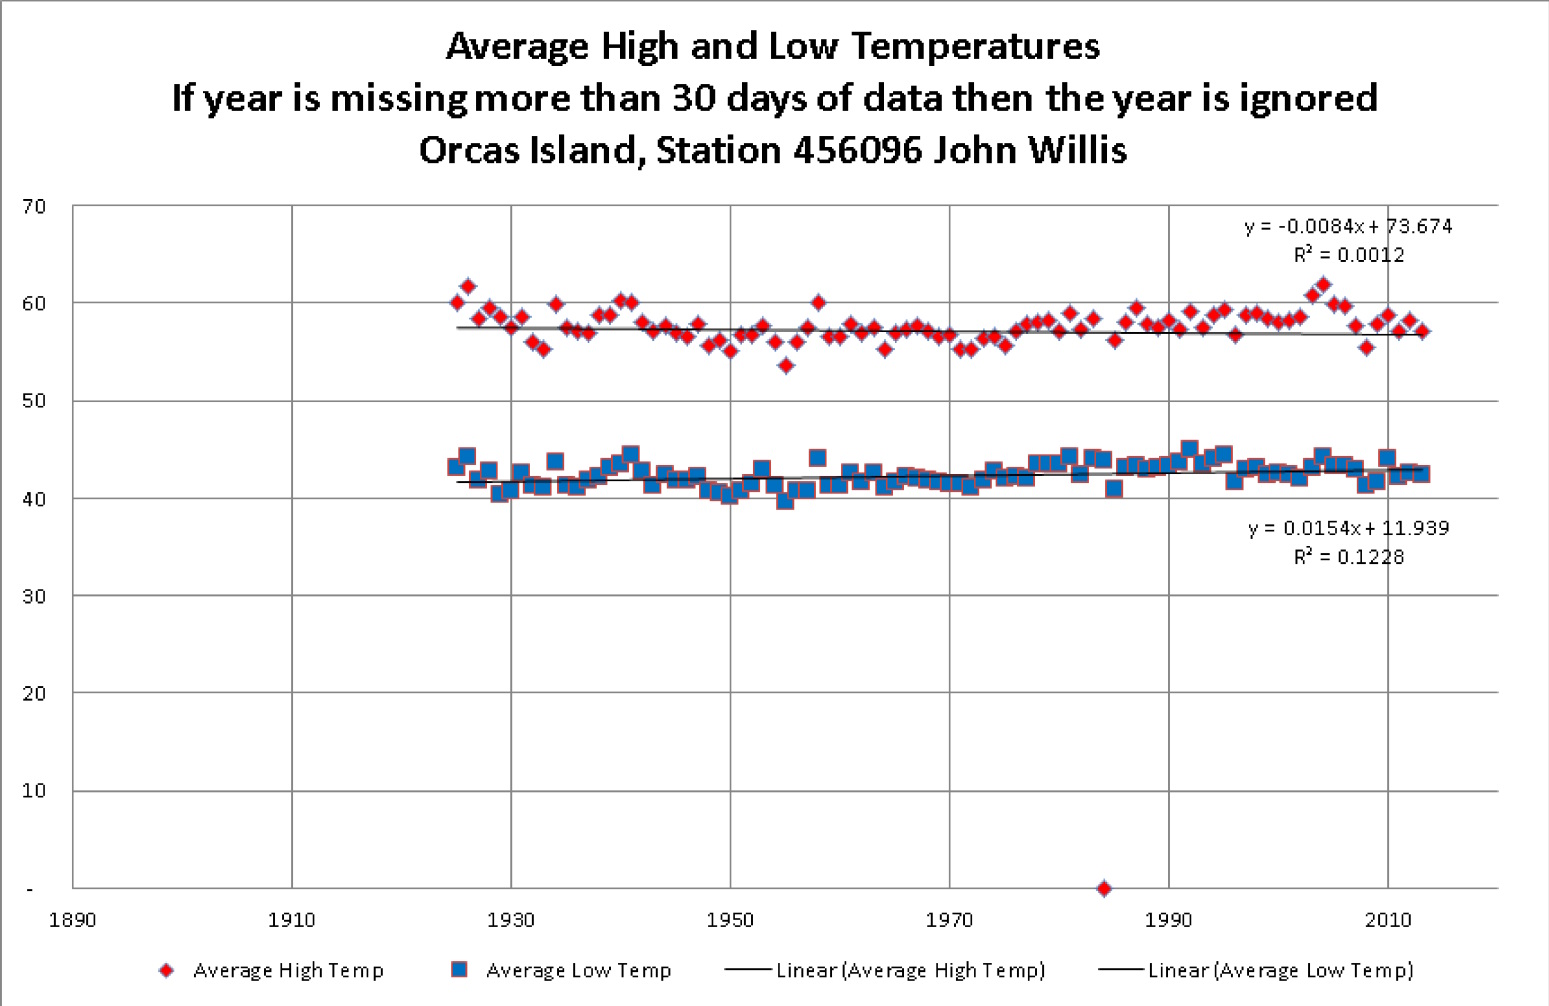
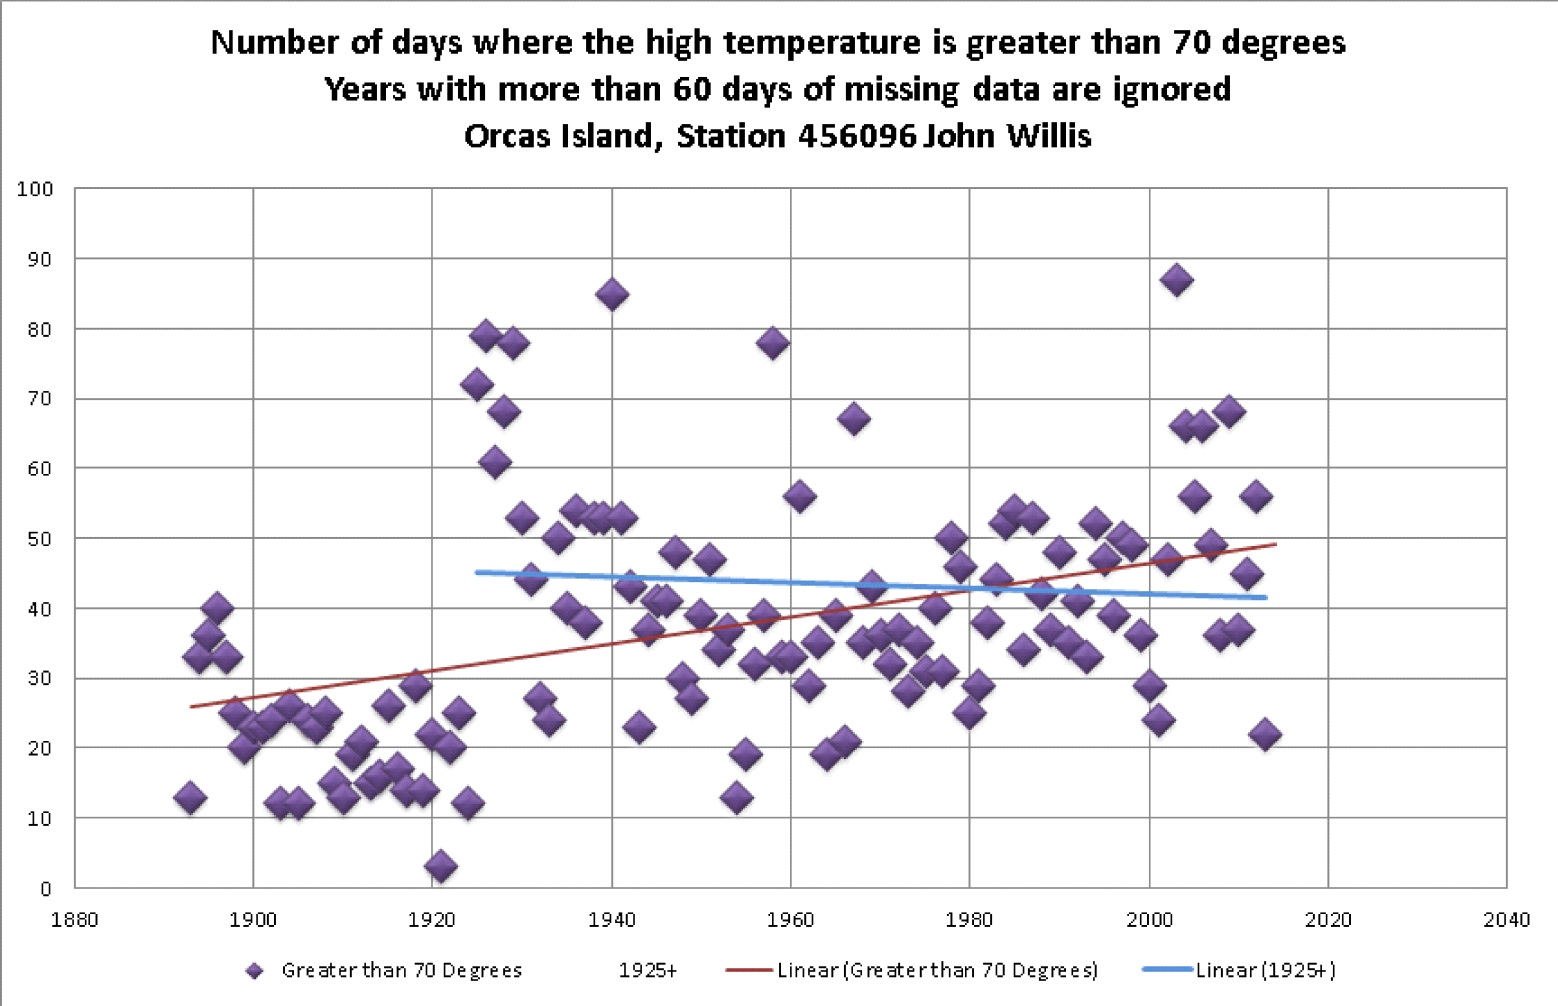
Two trend lines. One showing the trend for the period of record, 1893-2013. The second showing the trend since 1925. One shows a warming trend, the other a cooling trend. In December 1924 the temperature gauge was relocated from a shelter to the porch on the south side of the home. From that period on the temperature on Orcas Island averaged 2 degrees warmer than during the prior 30 years – a distinction clearly visible in the records.
These are the notes associated with the station. (provided by Mark Albright, University of Washington, Research Meteorologist)
Apr 1897 temperature was measured on veranda on N side of house.
time of obs 7am, 2pm, 9pm
Feb 1906 temperature was measured N side of house under open porch
Aug 1917 temperature still measured N side of house under open porch
even though shelter had been sent “long ago”
Apr 1925 Since December temperature measured under roof of S porch of house
after shelter blown over by storm. New shelter planned in a
few weeks.
Jul 1927 Obs time 7 PM, Culver Willis became observer after death of father
Cecil Willis, who was killed in logging accident
Oct 1928 Exposure of temperature equipment is not creditable, as
thermometers are mounted under a porch on S side of residence.
For 3 years shelter has sat out on lawn unused.
Jul 1985 John Willis becomes observer after death of his father,
Culver Willis (~age 87), who took observations for almost 60 years.